
Executive Summary:
- Meatbox Global has been shifting from low-margin logistics trade toward a higher-value B2B distribution platform model, and the proof is in the earnings inflection: 2026Q1 operating margin rose to 4.6% on 22.7 USD M of revenue, after a softer 2025Q2 quarter.
- Annual performance shows that Meatbox can remain profitable while scaling, but profitability and cash conversion are still not fully stable. 2024 delivered a 2.83% operating margin and 5.1 USD M in free cash flow, while 2025 net income remained positive at 1.2 USD M despite a lower margin profile (2.14% OPM) and weaker cash conversion.
- The industry backdrop remains supportive for digital B2B livestock distribution, but whether this is a broad industry recovery or a Meatbox-specific improvement still needs confirmation through transaction volume, active buyer counts, and reorder rates.
- What matters now: whether the 2026Q1 margin improvement is repeatable across more quarters, not just a one-off with better cost absorption.
- Key risk in one line: cold-chain and operating leverage can turn against the business quickly when purchase prices and logistics costs move out of sync.
Investment View in One Line
The business looks like a distribution operator with real platform earnings leverage — if margin discipline holds, the market’s current valuation may start to look less like a “value trap” and more like a transition story.
Why This Korean Stock Matters
Within the Korean online livestock B2B ecosystem, the difference between “moving product” and “running a trading system” is usually visible in margins and cash conversion. Meatbox Global (the operator of the Meatbox B2B livestock trading platform) has recently improved its operating line enough to make investors ask a simpler question: is this still a commodity distribution business, or has management built a platform that earns more efficiently as transaction volume grows? The company explains that its approach — daily price information, cold-chain execution, and operational data used to reduce stockouts and optimize logistics — points to that platform direction, even if it has not yet reached high-margin scale.
This is the logic from the provided thesis: the business shows a confirmed earnings recovery in the recent quarter, it is built as an online livestock B2B platform with cold-chain execution (platform expansion can create monetization leverage), and internal buying signals management’s confidence. CEO Kim Ki-bong purchased 10,500 shares across three open-market transactions on April 27–29, 2026, and Managing Director Oh Se-heung holds 7,943 shares per a separate open-market purchase disclosure dated May 27, 2026. I’m not treating internal buying as a fundamental driver by itself; I’m treating it as a credibility check around a real operating inflection that the numbers are beginning to support.
Core Investment Thesis
1. Earnings quality is improving faster than revenue growth
The company’s 2026Q1 operating margin climbed to 4.6% while revenue increased to 22.7 USD M, after prior quarters showed weaker profitability. That pattern matters because it points to cost absorption and process tightening, not just topline momentum.
2. The business is platform-shaped, not warehouse-shaped
Meatbox combines transaction facilitation, pricing transparency, and cold-chain delivery, which is the typical recipe for reducing trading frictions in B2B food supply. The key question is whether this structure translates into actual transaction volume growth and repeat-purchase retention — if execution remains consistent, the platform layer can monetize scale rather than only expanding labor and logistics costs.
3. Cold-chain execution creates both differentiation and margin risk
Keeping product quality through the full temperature-controlled journey supports repeat purchasing by professional buyers, but it also means cost structure is less forgiving when volume fluctuates. In practice, that makes margin durability the single variable to watch — especially beyond the next two quarters.
Business Model Explained
Meatbox operates in Korean livestock-related online B2B distribution, where customers are typically restaurants, butcher shops, and other small professional buyers that need reliable supply, frequent pricing updates, and fewer “lost sale” moments when items are unavailable. The core operational advantage is not a chemical formulation or an IP moat — it is execution: daily pricing information, transaction transparency between supply and demand, and cold-chain logistics that reduce quality risk for customers.
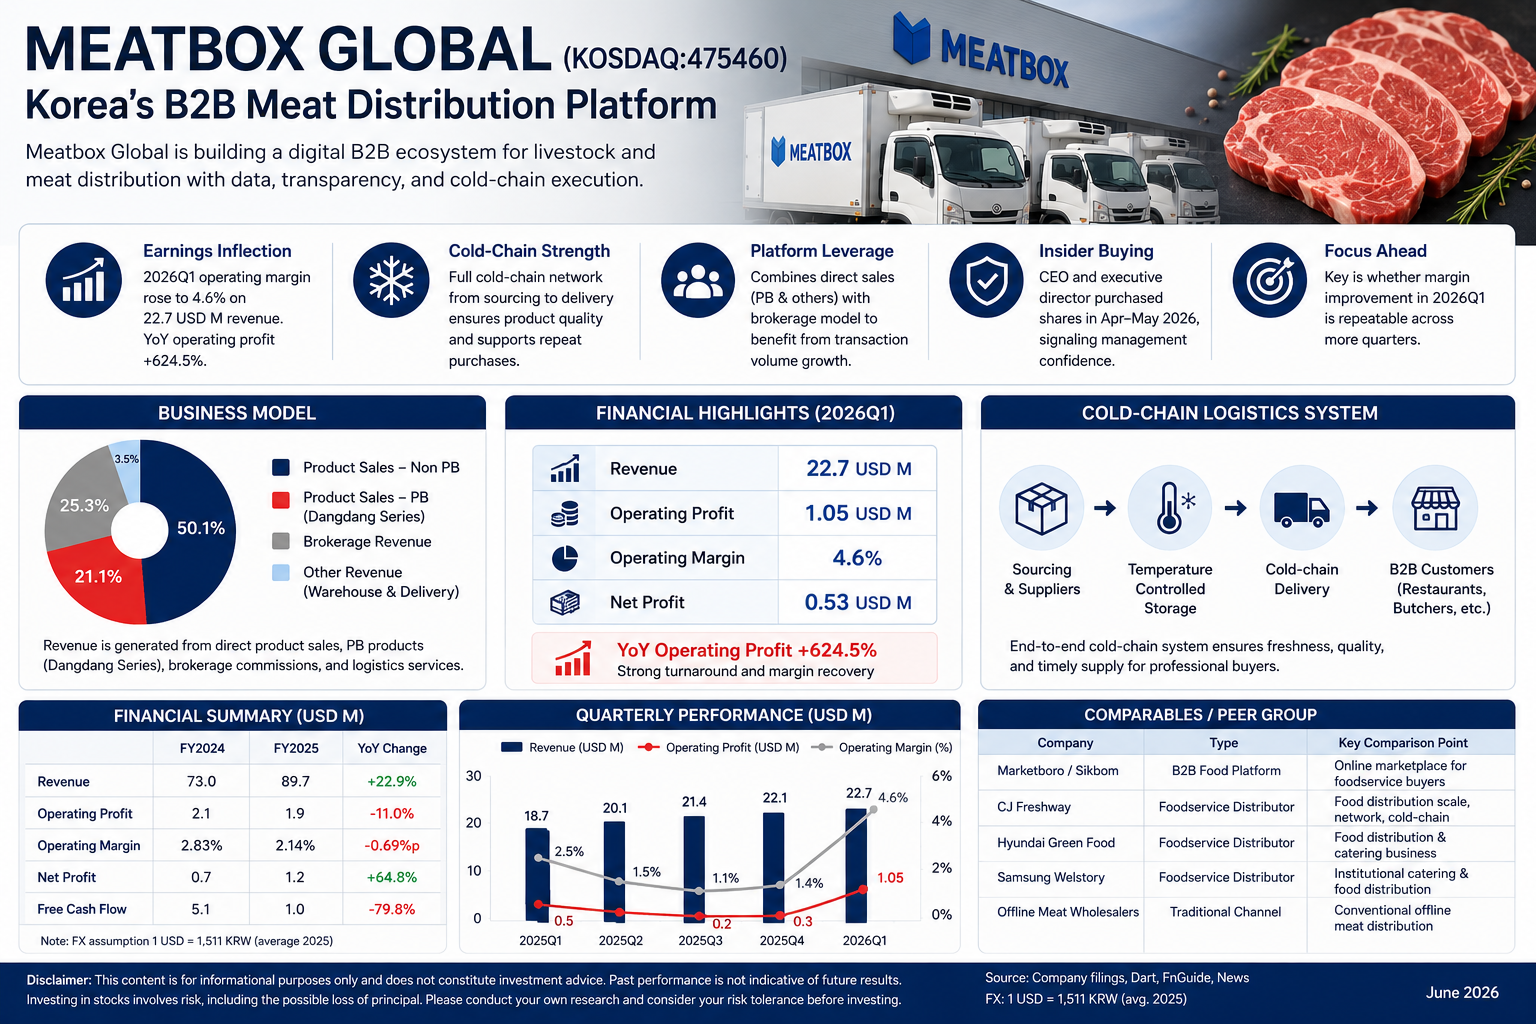
A key analytical point is that “platform” here should be understood as a trading and logistics system, not a pure software marketplace. That framing changes how you read profitability: margins come from how efficiently the company buys, routes, fulfills, and manages working capital across transactions — not only from revenue growth in isolation.
| Segment | % of Revenue | Description |
|---|---|---|
| Product sales (non-PB) | 50.10% | Direct import/purchase-based livestock sales; spread-sensitive |
| Product sales (PB) | 21.08% | “Dangdang” private-brand series; customer lock-in function |
| Brokerage revenue | 25.34% | Platform commission from third-party sellers |
| Other revenue | 3.48% | Warehousing and logistics delivery services |
※ Per research estimates, 2026Q1 revenue composition shifted to approximately product sales 70.4%, brokerage 27.1%, and other 2.5%, maintaining the product-sales-dominant structure.
Revenue & Margin Snapshot
| Item | 2024 | 2025 |
|---|---|---|
| Revenue | 73.0 | 89.7 |
| Op. Profit | 2.1 | 1.9 |
| Op. Margin | 2.83% | 2.14% |
| Net Income | 0.7 | 1.2 |
| OCF | 5.5 | 1.0 |
| CAPEX | 0.4 | 0.3 |
| ROE (self-calc.) | 6.5% | 4.6% |
※ ROE is self-calculated (net income / ending equity). Research sources using average equity (e.g. Mirae Asset: 11.5%/6.4%) will show different figures due to methodology differences.
| Quarter | Revenue | Op. Profit | Op. Margin | Net Income |
|---|---|---|---|---|
| 2026Q1 | 22.7 | 1.1 | 4.6% | 0.5 |
| 2025Q4 | 22.6 | 1.3 | 5.9% | 0.7 |
| 2025Q3 | 27.5 | 0.6 | 2.3% | 0.5 |
| 2025Q2 | 20.9 | -0.2 | -0.9% | -0.3 |
| 2025Q1 | 18.7 | 0.1 | 0.8% | 0.2 |
▶ Quarterly Revenue & Operating Profit Trend (2025Q1–2026Q1, USD M)

Meatbox’s revenue trajectory and operating margin behavior show a business that can re-rate operationally when execution improves, but still carries volatility from a cost and price-sensitive supply chain. Values in this article are in USD million (USD M), approximate at 1,511 KRW/USD.
What’s Driving the Numbers
Meatbox’s revenue growth should be interpreted in three layers. First, rising livestock prices and KRW/USD exchange rate movements can inflate KRW-denominated transaction values even at flat volumes — since the company sources imported beef and pork, a weaker won raises raw material costs in won terms, which can boost reported revenue while simultaneously pressuring margins. Second, the increasing share of direct product sales (non-PB and PB combined, roughly 71% of 2025 revenue) means the company recognizes more gross revenue per transaction versus brokerage-only income. Third, expansion into new product formats (small-portion cuts, processed items, food-service ingredients) can drive structural order growth if it translates into more active buyers and higher reorder frequency. For investors, tracking volume, reorder rates, and operating margin together matters more than headline revenue growth alone.
On valuation, the market is currently treating Meatbox as a low-to-mid profitability distribution platform, not a high-margin online marketplace. That interpretation aligns with the company’s still-modest cash generation profile and the fact that margins are not yet consistently high across years — 2025 operating margin narrowed to 2.14% versus 2.83% in 2024 even with positive net income. The result is a stock priced with a relatively grounded expectation of earnings quality, reflected in the current multiples: PER 21.4× and PBR 0.97× (as of 2026-06-02). A platform transition can be recognized by the market only when profitability becomes more durable, not just when one quarter surprises to the upside.
Recent Quarterly Performance
The recent quarter set shows a clear turning point. 2025Q2 was loss-making at the operating line (operating margin -0.9%), and by 2025Q4 profitability had recovered (operating margin 5.9%), before settling at 4.6% in 2026Q1. This is not a smooth climb; it is an oscillation that typically happens when logistics costs, purchase-price spreads, and order mix shift — but the amplitude has shortened. The 2026Q1 outcome matters because it shows management can convert higher revenue (22.7 USD M) into improved operating economics quickly, rather than waiting for year-end scale benefits.
Industry Context & Competitive Position
Korean online B2B livestock trading is increasingly shaped by data-driven forecasting and temperature-controlled logistics. The demand driver is intuitive: restaurants and butcher shops want fewer stockouts, faster settlement mechanics, and daily price clarity so they can manage margins under changing supply conditions. In that context, a vertical platform can earn loyalty by reducing the “operational tax” of sourcing and fulfillment — even if it remains structurally lower margin than a pure software business.
The 2026Q1 quarterly profitability rebound can be viewed as a company-specific improvement signal, but whether it represents a broader industry recovery still requires confirmation through transaction volume, active buyer counts, and reorder rate trends across multiple quarters.
| Company/Service | Category | Comparison Point vs. Meatbox |
|---|---|---|
| Marketboro / Sikbom | B2B food ingredient platform | Online marketplace for restaurant operators; closest platform-model peer |
| CJ Freshway | Large-scale food distribution | Nationwide food supply network, franchise/restaurant client base, cold-chain capability |
| Hyundai Green Food | Food distribution / catering | Food distribution, institutional catering, and restaurant operations |
| Samsung Welstory | Food distribution / catering | Large-scale institutional catering and food supply infrastructure |
| Offline livestock wholesalers | Direct substitution market | The traditional distribution channel Meatbox aims to displace |
※ Global meat production/processing companies (JBS, Cargill) sit upstream in the value chain and are not direct competitors. Direct valuation comparison with any of the above is limited due to structural differences.
Balance Sheet & Financial Stability
The company’s financial stability story is best read through cash flow consistency and reinvestment discipline. Operating cash flow fell sharply in 2025 versus 2024, and free cash flow turned materially smaller — so even when the income statement improves, the working-capital and timing effects still deserve attention. Still, capital intensity appears limited, with CAPEX staying relatively small (~0.3–0.4 USD M annually), which means profitability improvement can translate into cash faster if the revenue mix and settlement cycle stay favorable.
An important structural note: as of year-end 2025, the company carries approximately 16.2 USD M (KRW 24.5B) in non-current bonds payable — comprising a KRW 14.5B subordinated profit-participating bond at subsidiary MeatMatch Lending and a KRW 10.0B unsecured private-placement bond at Meatbox Global. Even though cash and financial assets appear substantial on the balance sheet, a net financial asset perspective (financial assets minus long-term debt obligations) gives a more accurate picture of the company’s true liquidity cushion.
| Year | OCF (USD M) | CAPEX (USD M) | FCF (USD M) | Non-current bonds (USD M) |
|---|---|---|---|---|
| 2024 | 5.5 | 0.4 | 5.1 | — |
| 2025 | 1.0 | 0.3 | 0.7 | 16.2 |
Valuation Perspective
At the current level, the market is valuing Meatbox with a PER of 21.4× and PBR of 0.97×, alongside an estimated market capitalization of about 24.0 USD M (as of 2026-06-02). The PBR under one time book reads like skepticism toward sustained profitability, while the PER indicates investors still expect net income to improve from recent quarters rather than deteriorate further. Relative to sector norms, these multiples look more “transition” oriented than “mature platform,” meaning the market wants durable earnings proof, not only growth.
Peers in this sector typically trade at a wide range depending on whether the company is judged as logistics-heavy distribution or a platform with repeatable contribution margins.
Key Risks
1. Margin volatility from livestock pricing and spreads
Because the company’s core model depends on sourcing and selling goods through variable supply conditions, the spread between purchase and selling prices can tighten unexpectedly. With annual operating margins in the 2–3% range, even small spread compression can erase profitability in a given quarter (as seen in 2025Q2).
2. Cold-chain operating cost pressure and fixed-cost leverage
Temperature-controlled delivery adds cost that is harder to scale down instantly when order patterns weaken. If volume does not rise in line with logistics expansion, the business can experience margin drawdowns even if revenue grows.
3. FX sensitivity on imported meat purchases
Per the annual report’s financial risk disclosures, a 10% currency fluctuation could impact pre-tax income by approximately ±1.3 USD M (±KRW 1.9B, USD-denominated exposure). Actual impact depends on purchase timing, settlement currency, and any hedging in place. Given the low operating margin structure, even modest FX-driven cost increases can meaningfully affect quarterly profitability.
4. Competitive intensity in vertical B2B distribution
B2B food ingredient platforms like Marketboro/Sikbom are scaling transaction volumes, and large-scale distributors (CJ Freshway, Hyundai Green Food) can compete aggressively on price. The platform layer can help, but it does not fully protect against a buyer-supplier marketplace becoming commoditized.
5. Customer concentration risk
Restaurants account for 50.4% of 2025 revenue by customer type, followed by distributors at 24.9% and butcher shops at 14.2%. A downturn in any single customer segment — particularly restaurant spending — can translate quickly into revenue and commission income pressure.
What to Watch Next
- Whether 2026Q2 and 2026Q3 can hold operating margin in the mid-single-digit range rather than reverting to the softer band seen earlier.
- Cash flow quality: whether operating cash flow stabilizes closer to the 2024 level (~5.5 USD M) or continues to track lower, constraining reinvestment flexibility.
- Cold-chain service expansion execution and logistics cost per transaction as order density changes across regions.
- Whether revenue growth is driven by actual transaction volume and active buyer increases, or primarily by livestock price and FX effects.
- Non-current bond obligations (~16.2 USD M): monitoring net financial asset position as a check on true liquidity.
FAQ
QWhat does Meatbox’s business model look like — distribution or platform?
Meatbox operates physical B2B livestock distribution, but it overlays a platform-like system through daily pricing transparency, order support, and cold-chain execution. It is best understood as a hybrid of distribution operations and platform logistics — not a pure software marketplace. Revenue comes mainly from direct product sales, which accounted for about 71% of 2025 revenue, while brokerage revenue contributed about 25%.
QIs the story primarily about revenue growth or profitability?
In this period, profitability is doing the heavy lifting. The recent rebound in operating margin to 4.6% in 2026Q1 after weaker quarters is the pattern that investors should focus on most. However, revenue growth should be decomposed into price effects, FX effects, and actual volume growth to assess quality.
QHow sensitive is the business to livestock price swings?
High, because purchase prices and selling prices can move differently by item, SKU, and supplier conditions. When spreads compress, margins tighten quickly — so tracking cost discipline and order mix becomes critical. FX exposure adds another layer: a 10% currency move could swing pre-tax income by approximately ±1.3 USD M.
QDoes internal management buying matter?
CEO Kim Ki-bong purchased 10,500 shares across three open-market transactions in late April 2026, and Managing Director Oh Se-heung holds 7,943 shares per a May 2026 disclosure. These are credibility signals, but they are not substitutes for durable operating performance. The market’s willingness to expand valuation usually depends on whether margin and cash flow trends confirm the operating inflection across multiple quarters.
QWhat should a foreign investor monitor in quarterly results?
Watch operating margin trajectory, cash conversion from operating cash flow, and whether cold-chain costs scale efficiently with order density. Also monitor the non-current bond profile (~16.2 USD M) and net financial asset position. If these move together favorably, the company’s platform transition thesis becomes more believable.
QHow should I interpret the revenue increase?
Three layers: (1) livestock price and FX movements can inflate KRW-denominated revenue even at flat volumes; (2) higher direct product sales share (vs. brokerage) means more gross revenue recognition per transaction; (3) expansion into new product formats can drive structural volume growth if it reaches more active buyers. Tracking volume, reorder rates, and operating margin together matters more than headline revenue alone.
Key References
- Meatbox Global 2025 Annual Report (KIND filing, submitted 2026.03.20)
- Meatbox Global 2026Q1 earnings disclosure and related press releases
- Mirae Asset Securities research on Meatbox Global