Executive Summary:
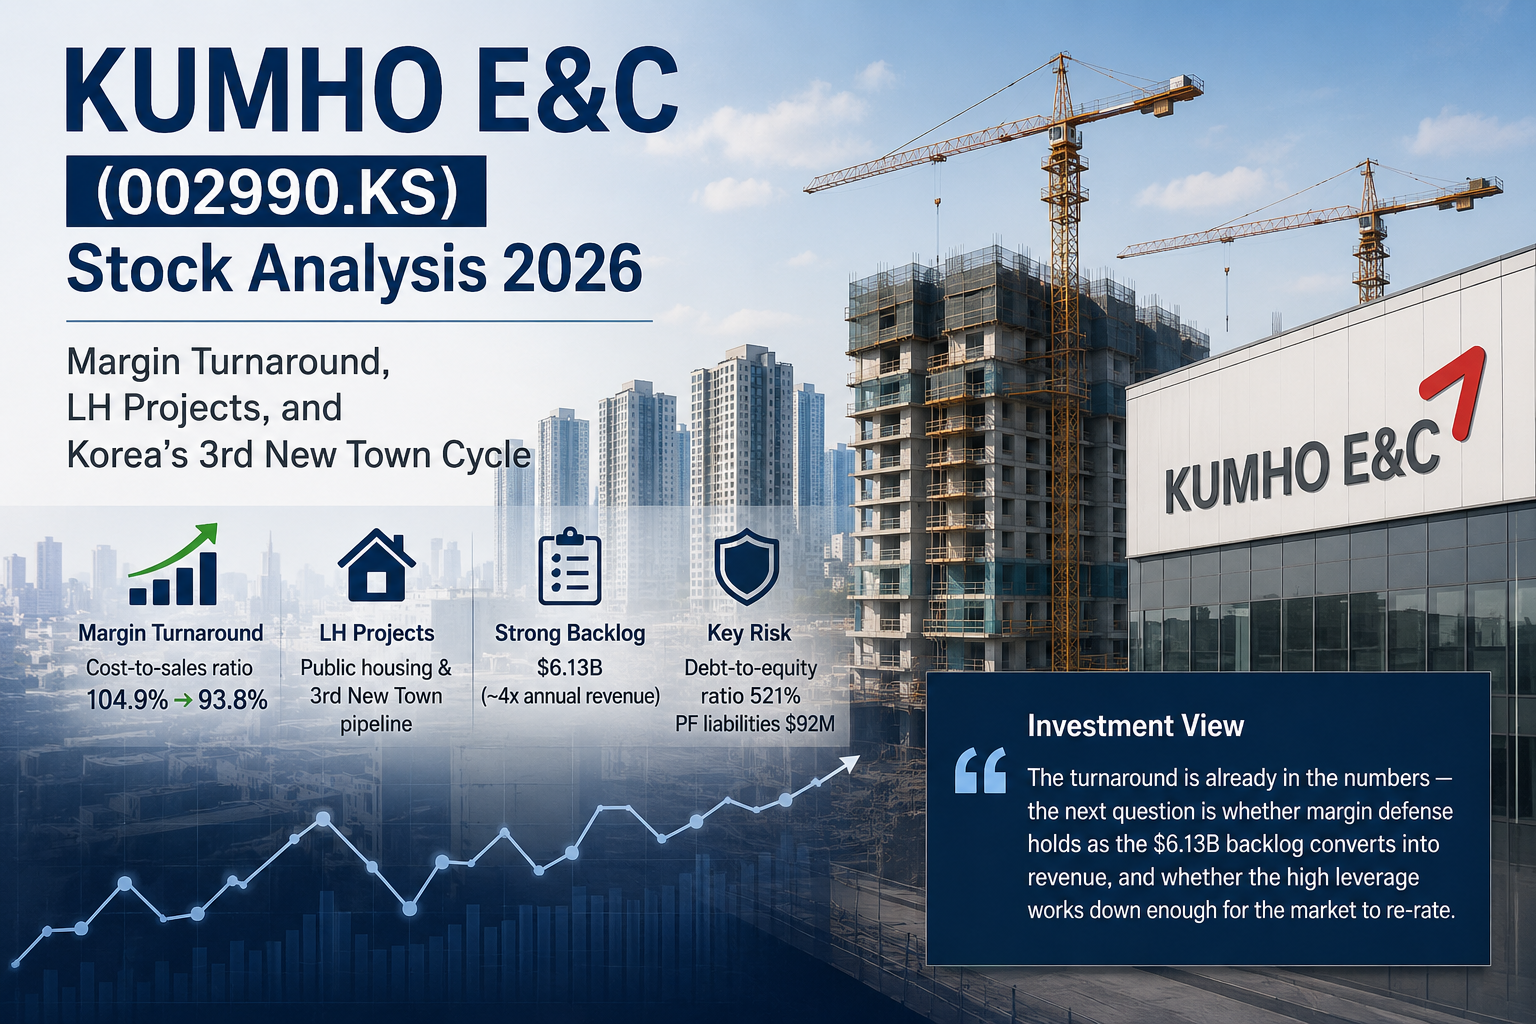
- Operating profit swung from −$119.9M in 2024 to +$31.0M in 2025, but the more useful number is the cost-to-sales ratio — it dropped from 104.9% to 93.8%, an 11-point move that is the actual mechanism behind the margin recovery.
- Cash also followed the recovery: operating cash flow rebounded to $52.9M in 2024 and stayed positive at $33.6M in 2025, with free cash flow at $33.5M.
- Order momentum is concentrated on the public side rather than private housing — Kumho E&C cited LH private-sector participation projects (LH-led public housing development involving private contractors) as a driver of its 2025 new orders (~$1.87B), with named pipeline including Namyangju Wangsuk 1 PM-3, Gwangmyeong Hak-on S2/S3, Pyeongtaek Godeok A63/A64, Bucheon Daejang A5/A6, and the Pyeongtaek power tunnel project.
- Backlog hit ~$6.13B (about 4× annual revenue), so the question is no longer “is there work to do” but “can the work be executed without repeating the 2024 cost shock.”
- Key risk in one line: debt-to-equity ratio is still 521% and ~$92M of PF-related contingent liabilities remain, so even with profits returning, the multiple can stay compressed until the balance sheet de-risks further.
Investment View in One Line
The turnaround is already in the numbers — the next question is whether margin defense holds as the $6.13B backlog converts into revenue, and whether the still-elevated 521% leverage works down enough for the market to re-rate.
Why This Korean Stock Matters
Kumho E&C (Korean name: 금호건설) is the kind of Korean construction story where the headline number — a deep loss reversing into profit — only makes sense once you look at the underlying cost ratio. In 2024, the cost-to-sales ratio hit 104.9%, meaning recognized project costs exceeded recognized revenue. By 2025, that ratio dropped to 93.8%. Eleven points in one year. That’s the engine behind the move from a −$119.9M operating loss to a +$31.0M operating profit, on roughly flat revenue.
What makes this case actionable rather than a generic cycle call: the recovery is showing up in cash too. Operating cash flow turned positive at $52.9M in 2024 even while the income statement showed a deep loss, which suggests the 2024 loss was cushioned at the cash-flow level by non-cash charges and/or working-capital movements. (provisions, valuation adjustments). Then 2025 added a profit-backed $33.6M of OCF. In a contracting business where working-capital timing can mislead investors, that’s a useful confirmation that the recovery is operational, not just accounting noise.
The thesis aligns with what management is signaling in the order book: 2025 new orders of about $1.87B were attributed in part to LH private-sector participation projects, and backlog grew to roughly $6.13B (about 4× annual revenue). I would treat the cost-side improvement as the proven part, and treat backlog conversion as the open question still being tested quarter by quarter.
Why this Korean construction contractor: the move from a 104.9% to a 93.8% cost-to-sales ratio is the kind of measurable, mechanical change that can drive a re-rating — if backlog conversion stays clean and the 521% debt-to-equity ratio works down.
Core Investment Thesis
1. The cost-side problem is closing, not the demand side improving
Revenue moved only modestly between 2024 ($1,261M) and 2025 ($1,330M). The actual driver of the turnaround was cost-to-sales dropping from 104.9% to 93.8% — high-cost legacy sites rolling off the books rather than a broad demand recovery. Q1 2026 followed through with a 2.7% operating margin, so the cost discipline appears to be holding into the next year.
2. Order book is tilted to public-led work, not private apartment sales
New orders of about $1.87B in 2025 were attributed in part to LH private-sector participation projects. Named work includes Namyangju Wangsuk 1 PM-3, Gwangmyeong Hak-on S2/S3, Pyeongtaek Godeok A63/A64, Bucheon Daejang A5/A6, and the Pyeongtaek power tunnel project — public housing, Korea’s 3rd New Town program, and infrastructure rather than the private housing cycle that’s still waiting to recover. So this is better read as a public-cycle beneficiary than a private-housing rebound play.
3. Backlog at ~$6.13B gives revenue visibility — the question shifts to execution
Year-end backlog of about $6.13B is roughly 4× annual revenue. The “is there work to do” question is settled. What’s left to prove is that the work gets executed at margins similar to what 2025 just demonstrated, rather than rebuilding the 2024 cost overhang on the next wave of projects.
Business Model Explained
Kumho E&C is a Korean construction contractor recognizing revenue on a percentage-of-completion basis across housing, infrastructure, and building segments. About 78% of revenue comes from two segments — Housing/Development (40.4%) and Civil/Plant/Environment (37.9%) — and the rest is Building (16.6%), Overseas (3.6%), and Other (1.5%). For practical purposes this is a domestic Korean contractor; overseas exposure exists but is small enough that it doesn’t move the income statement.
| Segment | % of Revenue | Description |
|---|---|---|
| Housing / Development | 40.4% | Apartment and housing-style contracted construction |
| Civil / Plant / Environment | 37.9% | Civil engineering, plant, and environmental contracts |
| Building | 16.6% | Public and private building contracts |
| Overseas | 3.6% | Project-specific overseas contracts |
| Other | 1.5% | Non-core revenue |
※ Segment shares may differ slightly from IR’s housing/civil/building/overseas classification depending on the financial-data taxonomy used.
Because all segments recognize revenue on percentage-of-completion, current-site cost behavior flows almost immediately into reported margins. That’s a double-edge: when things go right, revenue is booked early; when a site goes sideways, the loss also lands early. The −40.7% operating margin in 2024Q3 was exactly this — concentrated cost recognition on a few problematic sites — and the 2025 normalization is the same mechanism running in reverse.
Smart construction systems (BIM, AI-based safety, IoT) are part of the company’s R&D agenda but are best treated as execution-support, not a near-term revenue line. The relevant test is whether they reduce cost overruns on the jobs in backlog — that would show up in gross margin rather than in any separate revenue category.
Revenue & Margin Snapshot
| Item | 2022 | 2023 | 2024 | 2025 |
|---|---|---|---|---|
| Revenue | 1,350 | 1,461 | 1,261 | 1,330 |
| Op. Profit | 37 | 14 | -120 | 31 |
| Op. Margin | 2.7% | 1.0% | -9.5% | 2.3% |
| Net Income | 14 | 0 | -151 | 41 |
| OCF | 38 | -102 | 53 | 34 |
| CAPEX | 0.5 | 0.5 | 0.1 | 0.1 |
| ROE | 3.8% | 0.2% | -101.4% | 25.7% |
▶ Revenue & Operating Profit Trend (USD M, approx.)

| Quarter | Revenue | Op. Profit | Op. Margin | Net Income |
|---|---|---|---|---|
| 2026Q1 | 299 | 8 | 2.7% | 7 |
| 2025Q4 | 327 | 6 | 2.0% | 29 |
| 2025Q3 | 345 | 10 | 2.9% | 5 |
| 2025Q2 | 350 | 11 | 3.0% | 7 |
| 2025Q1 | 308 | 4 | 1.2% | 1 |
| 2024Q4 | 344 | 4 | 1.0% | 1 |
| 2024Q3 | 255 | -104 | -40.7% | -125 |
| 2024Q2 | 337 | -21 | -6.1% | -25 |
▶ Quarterly Revenue & Operating Profit Trend (USD M, approx.)

Revenue has been roughly flat across the four years (between $1,261M and $1,461M). What moved was margins — and what moved margins was cost-to-sales. A 105% cost ratio means there is no way to be profitable regardless of how much you sell; a 94% ratio means $1.3B of revenue can produce $31M of operating profit. The annual swing isn’t about volume.
Key takeaway from the financial trend
Margin recovery plus positive free cash flow is a stronger combination than either alone. Margin alone can be one-quarter accounting, and cash flow alone can be working-capital timing. The two together (2025 OCF $33.6M with profit returning) is the harder pattern to fake.
What’s Driving the Numbers
The most interesting datapoint in this story is actually 2024. Operating loss was −$119.9M, but operating cash flow that same year was +$52.9M. That’s a $173M gap, which means a meaningful portion of the 2024 income statement hit was non-cash — provisions, valuation adjustments, project loss accruals — rather than cash going out the door. This matters because it tells you the 2024 print looked worse than the underlying cash economics were, which is part of why the 2025 recovery isn’t as discontinuous as the income statement makes it appear.
For 2025, the mechanism is cleaner: cost-to-sales ratio went from 104.9% to 93.8%, the high-cost legacy sites finished rolling off, and the same $1.3B of revenue now drops $31M to operating profit instead of bleeding $120M. Q1 2026 followed through with revenue of $299M and operating margin of 2.7%, which is consistent with the cost discipline still holding.
On valuation, the market is pricing this as a still-risky execution engine — PER 2.6× and PBR 0.67× as of late May 2026, which is well below where a “stable contractor” typically trades. Two readings of that: either the market hasn’t caught up to the recovery yet, or the market is still discounting for the 521% debt-to-equity ratio and remaining PF contingent exposure of about $92M. Both can be true at the same time.
Recent Quarterly Performance
The quarterly pattern is what you’d expect from a contractor working through a cost-overhang cycle. 2024Q3 was the bottom (−40.7% operating margin), 2024Q4 turned barely positive (+1.0%), and from 2025Q2 onward operating margin has settled into the 2–3% range. 2026Q1 came in at 2.7% with positive net income — not strong by absolute standards, but consistent with what 2025 demonstrated. The shape is “stabilization,” not “acceleration,” and that’s actually the more credible scenario for a Korean contractor coming out of a project-cost shock.
Industry Context & Competitive Position
The Korean construction cycle in 2025 was characterized by selective recovery rather than broad strength — leading indicators (new orders, permits, housing starts) hadn’t recovered, and private housing starts in particular were still weak. Within that environment, the contractors best positioned were those with public-sector exposure rather than private apartment dependency. Kumho E&C’s tilt toward LH private-sector participation and Korea’s 3rd New Town program fits that thesis.
Material cost direction was mixed: rebar prices were up about 1%, ready-mix concrete prices were down about 2.5%. Margin outcomes therefore depend on project mix — which sites recognize cost in which quarter is what causes the quarterly volatility you can see in the chart above.
Kumho E&C’s competitive position is best understood as a mid-tier Korean contractor — roughly 20th in domestic construction capability rankings, well below the top-tier players like Hyundai E&C, GS E&C, and Daewoo E&C. Direct comparison isn’t really meaningful given the size and overseas-EPC gap, but the table below frames where Kumho E&C sits in the broader landscape:
| Company | Main Business | Positioning | Comparison Role |
|---|---|---|---|
| Kumho E&C | Civil/Plant/Env, Housing/Dev | ~Top 20 in domestic capability ranking | Subject company |
| Hyundai E&C | Large building, civil, plant | #1 in domestic capability ranking | Large EPC / overseas reference |
| GS E&C | Housing, urban redevelopment, civil | ~Top 5–6 in domestic capability ranking | Housing / redevelopment recovery reference |
| Daewoo E&C | Civil, housing, plant mix | ~Top 3–5 in domestic capability ranking | Mixed-portfolio reference |
※ Hyundai / GS / Daewoo are not direct peers given scale and overseas-EPC differences. Included as reference points for margin behavior comparison.
Balance Sheet & Financial Stability
This is where the case gets more demanding. Profit is back, but the balance sheet still carries a heavy load: debt-to-equity ratio of 521% at year-end 2025 (down from 589% at year-end 2024, but still high in absolute terms), ~$92M of PF-related contingent liabilities (down from about $249M previously, but not zero), and roughly $507M of near-term cash outflow items within three months based on financial-liability maturity disclosures. None of these individually break the thesis, but together they explain why the market hasn’t re-rated the multiples even after the profit recovery.
The cash flow side has been the positive surprise. 2023 was the stress year with OCF at −$101.9M and FCF at about −$102.4M. Then 2024 turned to +$52.9M OCF / +$52.8M FCF, and 2025 stayed positive at $33.6M / $33.5M. CAPEX is tiny ($0.1–0.5M) because the business is asset-light — most spending flows through working capital rather than fixed-asset investment. That’s why FCF roughly equals OCF here.
| Year | OCF (USD M) | CAPEX (USD M) | FCF (USD M) | ROE (%) |
|---|---|---|---|---|
| 2022 | 37.6 | 0.5 | 37.1 | 3.8 |
| 2023 | -101.9 | 0.5 | -102.4 | 0.2 |
| 2024 | 52.9 | 0.1 | 52.8 | -101.4 |
| 2025 | 33.6 | 0.1 | 33.5 | 25.7 |
FX convention used
All financial values are in USD million, approx. at 1,517 KRW/USD exchange rate.
Valuation Perspective
Market cap stands at ~$108M, with PER 2.6× and PBR 0.67× as of late May 2026. Those multiples are well below where a “normalized contractor” would typically trade, which is consistent with the market still requiring more quarters of margin defense before re-rating. The 521% leverage and remaining PF-related contingent items are the structural reasons the market isn’t extending the multiple even with profits returning.
The relevant valuation question isn’t “is this cheap on current earnings” — at 2.6× PER, the answer is obviously yes if current earnings persist. The question is whether 2025’s operating margin (2.3%) and Q1 2026’s (2.7%) represent a new baseline or a temporary catch-up after the prior year’s loss reversal.
In other words, Kumho E&C is not simply a low-PER stock. It is a balance-sheet de-risking story: if operating margin holds and the debt-to-equity ratio moves below 500%, the market may begin to treat the 2025 recovery as a real normalization rather than a one-year rebound.
Key Risks
Investment considerations: (1) Leverage at 521% structurally limits how far the multiple can stretch even with earnings recovery. (2) PF-related contingent exposure (~$92M, down from ~$249M) hasn’t disappeared — it’s smaller. (3) Backlog visibility helps, but contractor margins live and die on execution per project, so the next 2–3 quarters of operating margin are what actually proves the case.
1. Financial leverage (debt-to-equity 521%)
Year-end 2025 leverage came down from 589% to 521%, but it’s still very high in absolute terms. Even with profit returning, the market typically won’t extend multiples on a contractor at this leverage level until the ratio works down further. This is the structural discount factor.
2. PF-related contingent liabilities (~$92M remaining)
PF-related contingent exposure dropped from ~$249M to ~$92M, but credit-support structures (completion guarantees, SOC guarantees, interim-payment guarantees) remain. If domestic housing presales weaken further or specific sites deteriorate, contingent items can resurface in financials.
3. Industry cycle — leading indicators not recovering
2025 saw leading indicators (new orders, permits, housing starts) fail to recover meaningfully. If recognition timing on housing/development revenue slips further out, quarterly profit variance can widen. Backlog of $6.13B helps visibility, but the conversion timing still depends on the cycle.
4. Short-term liquidity management (~$507M of near-term cash outflow items)
Financial-liability maturity disclosures show roughly $507M of near-term cash outflow items within three months, including more than pure borrowings. With 2025 OCF at $33.6M, the company cannot cover this near-term maturity profile through annual OCF alone; refinancing, collections, and normal working-capital rollover remain important. Any tightening in credit availability is the variable to watch.
What to Watch Next
- Q2–Q3 2026 operating margin holding in the 2–3% range — confirms cost discipline isn’t a one-quarter event.
- OCF maintaining 2025’s pace, alongside stable refinancing and working-capital rollover for the ~$507M near-term cash outflow profile.
- Public housing project rollouts (Namyangju Wangsuk and similar) translating into actual revenue recognition.
- Debt-to-equity ratio working down below 500% — would shift the structural discount narrative.
- Any further reduction in PF-related contingent exposure or related credit-support obligations.
FAQ
QWhat is the actual mechanism behind Kumho E&C’s 2025 turnaround?
Costs ratio dropped from 104.9% in 2024 to 93.8% in 2025. Revenue barely moved — high-cost legacy sites finished rolling off, and the same $1.3B of revenue swung from a $120M loss to a $31M profit. It’s a cost story, not a volume story.
QHow should investors interpret the 2024 OCF being positive while operating profit was deeply negative?
It suggests the 2024 accounting loss was partly cushioned at the cash-flow level by non-cash charges and/or working-capital movements. — provisions, valuation adjustments, project loss accruals — rather than actual cash going out the door. The income statement looked worse than the underlying cash economics, which makes the 2025 recovery less discontinuous than it appears.
QWhat’s the order book situation?
Year-end 2025 backlog was about $6.13B, roughly 4× annual revenue. 2025 new orders were about $1.87B, with management citing LH private-sector participation projects as a driver. Named projects include Namyangju Wangsuk 1 PM-3, Gwangmyeong Hak-on S2/S3, Pyeongtaek Godeok A63/A64, Bucheon Daejang A5/A6, and the Pyeongtaek power tunnel project.
QWhy isn’t the stock re-rating if earnings are recovering?
Two reasons. Debt-to-equity is still 521% — high enough that markets typically don’t extend multiples until leverage works down. And PF-related contingent exposure of ~$92M is smaller than it was but hasn’t disappeared. The market is waiting for more quarters of confirmation plus balance-sheet improvement.
QIs this a private housing recovery play?
Not really. The order book is tilted toward public-led work — LH private-sector participation, Korea’s 3rd New Town program, public housing, and infrastructure. So Kumho E&C is better understood as a public-cycle beneficiary that doesn’t need the private housing market to recover, rather than a private housing rebound play.
QWhat operational signals should investors watch?
Operating margin holding in the 2–3% range across Q2–Q3 2026, OCF maintaining the 2025 pace to support near-term cash outflow items, and any further reduction in debt-to-equity or PF contingent exposure. Watch for margin compression in any single quarter — in a contractor, one bad site can reopen the 2024-style cost overhang.
Disclaimer
This material is provided for informational purposes only and does not constitute a solicitation or recommendation to buy or sell any security. All figures, projections, and analyses are based on publicly available information and may differ from actual results; they are subject to change without notice. The reader bears full responsibility for any investment decisions made. The author accepts no legal liability for any investment outcome arising from reliance on this material. All investment decisions should be made at the reader’s own discretion and risk. Independent professional investment advice should be sought where appropriate.
Visit the official Kumho E&C website for more information.
For more Korean small cap ideas, visit our Korean Small Cap Stocks section.
You can also read our Industry Analysis articles.
Here is my substack. There are more information for value. -> Hanalpha substack