파인텍 (FineTech) (131760.KS) Korean Stock Analysis 2026: Display & Battery Equipment Cycle Check
Executive Summary:
- FineTech is a korean stock that stands at the intersection of display equipment and secondary-battery manufacturing equipment. The core investor thesis: when the display and battery equipment cycle turns, FineTech’s order flow can improve sharply. Revenue of USD 31M in 2025 with Op.Profit -2.9B shows how sensitive the business is to cycle timing.
- Cash flow has been the weak link: FCF swung from +8M USD in 2023 to -13M USD in 2025, driven by CAPEX rising to 15.5B while OCF turned negative.
- A notable signal: significant insider buying is underway. Four executives purchased approx. USD 33K each, one bought 70M, another 100M, and the largest shareholder has been accumulating since August 2024 — 744,710 shares at an average of USD 0.50, totaling approx. USD 370K.
- What matters now: the next quarter’s profitability hinge is whether new orders convert into recognized work fast enough to stop the cost overhang.
- Key risk in one line: low controlling shareholder stake (9.47%) with 4.75% under collateral agreements creates forced-selling risk on top of cyclical demand volatility.
Investment View in One Line
FineTech’s story becomes investable when the display and battery equipment cycle turn shows up in order-to-earnings conversion — but governance risks (low stake + pledged shares) mean position sizing discipline matters as much as timing.
Why This Korean Stock Matters
FineTech is best understood as a timing-sensitive execution platform for equipment demand. The company wins during supply-plan pull-ins and bleeds when customers pause projects. You can see the business cycle in the earnings line itself: revenue dropped from USD 54M in 2022 to 44.8B in 2023, rebounded to 71.0B in 2024, then fell again to 46.4B in 2025. In a cyclical equipment business, that kind of whiplash is not noise — it is the whole game.
What makes FineTech worth watching right now is the combination of depressed valuations, heavy insider buying, and the potential for an industry cycle turn driven by ESS market growth and IT OLED investment.
Core Investment Thesis
1. Cycle-turn thesis: orders can jump when display and battery equipment demand turns
The ESS market is opening up new battery equipment opportunities, while IT OLED investment and India’s display manufacturing buildout are creating conditions for a display equipment recovery. When these cycles turn, FineTech’s order pipeline can improve rapidly — as demonstrated by the jump from USD 30M revenue in 2023 to 71.0B in 2024.
2. Insider buying signals management conviction
Recent insider activity is notable: four executives purchased approx. USD 33K each, one bought approx. USD 46K, and another invested approximately approx. USD 66K. More importantly, the largest shareholder (Kang Won-il) has been accumulating steadily since August 2024 — 744,710 shares at an average price of USD 0.50, totaling approx. USD 370K. This level of sustained personal capital commitment suggests management sees value the market is not yet pricing in.
3. Cash flow flexibility is the swing factor
FCF was positive in 2021–2023 (peaking at +8M USD in 2023), but reversed to -4M USD in 2024 and -13M USD in 2025 as CAPEX rose to 15.5B. Whether this investment converts to revenue in coming quarters is the key financial question.
Business Model Explained
FineTech operates as a specialized equipment and component supplier where customer line investment decisions dictate order timing. The business has two main pillars:
Display equipment (59.6% of revenue): COG/COF/COP bonding equipment, AOI/ART inspection equipment for panel manufacturing lines. When display panel or battery production plans accelerate, equipment demand shows up before end-product volume — this is where equipment vendors capture share of attention and budgets.
Display components (31.2% of revenue): Touch System modules for appliance displays and Digitizer components for mobile displays provide a more stable, albeit lower-margin, revenue base.
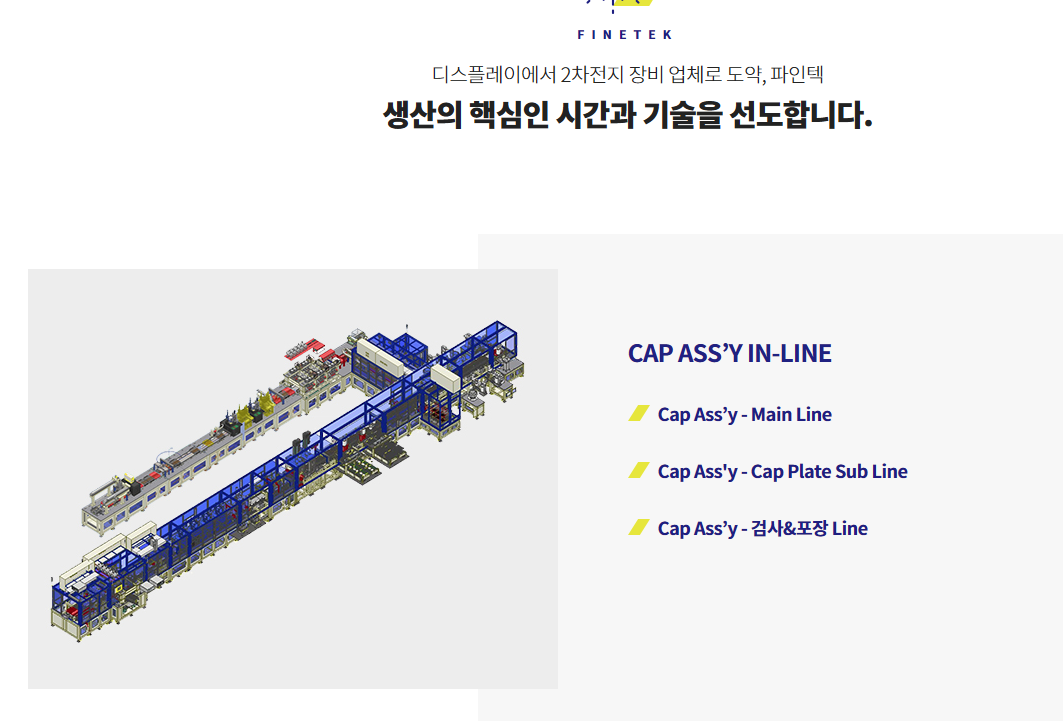
Battery & bonding equipment (7.7% of revenue): Secondary battery manufacturing equipment including cap assembly lines, winding post-process equipment, 2D marking, and stack bonding systems. This segment is small but represents the growth optionality tied to ESS and EV battery investment cycles.
| Segment | Revenue (USD M) | Share | Description |
|---|---|---|---|
| Display Manufacturing Equipment | 18.3 | 59.6% | Bonding, inspection, panel line equipment |
| Touch System | 8.1 | 26.7% | Appliance display components |
| Bonding / Battery Equipment | 2.4 | 7.7% | Cap assembly, stacking, marking for batteries |
| Digitizer | 1.4 | 4.5% | Mobile display components |
| Other | 0 | 1.5% | Misc. components |
Revenue & Margin Snapshot
| Item | 2022 | 2023 | 2024 | 2025 |
|---|---|---|---|---|
| Revenue | 54 | 30 | 47 | 31 |
| Op. Profit | 4 | -3 | 1 | -2 |
| Op. Margin | 8.2% | -9.4% | 2.6% | -6.3% |
| Net Income | 4 | -5 | 2 | -5 |
| OCF | 4 | 8 | 0 | -2 |
| CAPEX | 2 | 0 | 4 | 10 |
| FCF | 2 | 8 | -4 | -13 |
| ROE | 17.1% | -25.2% | 7.3% | -29.3% |
▶ Annual Revenue & Operating Profit Trend (USD M, approx.)

| Quarter | Revenue | Op. Profit | Op. Margin | Net Income |
|---|---|---|---|---|
| 2025Q4 | 9 | -0 | -2.1% | -2 |
| 2025Q3 | 10 | -1 | -10.7% | -1 |
| 2025Q2 | 5 | -0 | -6.5% | -1 |
| 2025Q1 | 7 | -0 | -5.5% | -1 |
| 2024Q4 | 8 | -1 | -7.7% | -0 |
| 2024Q3 | 17 | 1 | 4.7% | 1.1 |
| 2024Q2 | 11 | 0 | 2.2% | 0 |
| 2024Q1 | 10 | 1 | 8.2% | 1 |
▶ Quarterly Revenue & Operating Profit Trend (USD M, approx.)

Key takeaway from the financial trend
The most telling pattern is the alternating cycle: strong revenue years (2022, 2024) are followed by sharp contractions (2023, 2025). Operating margins have only been positive in cycle-up years, and 2025Q4 operating loss of -0.3B was the narrowest quarterly deficit — potentially signaling a trough if order flow picks up.
Industry Context & Competitive Position
FineTech sits in display components/equipment and battery manufacturing equipment — segments where customer capex plans, not consumer demand, drive order timing. Industry conditions point to OLED-centered investments (particularly IT OLED panels) and ESS-driven battery manufacturing ramps as potential catalysts. India’s emerging display manufacturing investment is an additional demand vector.
The equipment business is inherently custom-build: specifications are set by individual customers, making mass production impossible and technical qualification a meaningful entry barrier.
| Company | Main Products | Positioning | Key Strength | Rev. (USD M) |
|---|---|---|---|---|
| FineTech | Bonding/inspection equipment, Touch System, battery equipment | Equipment + component hybrid | Custom-build responsiveness, process know-how | 31 |
| AP Systems | OLED laser equipment, lamination | OLED post-process leader | Dominant laser process position with Samsung Display | — |
| SFA Engineering | Display logistics & automation equipment | Top-tier large display equipment | Samsung-affiliated logistics automation strength | — |
| Philoptics | Laser processing, battery notching equipment | Display + battery dual-track | Laser-based precision processing technology | — |
FineTech’s differentiation lies in combining equipment and component businesses under one roof, but it is smaller in scale and customer diversification compared to AP Systems or SFA Engineering. The battery equipment segment remains a growth option rather than a proven revenue driver at this stage.
Valuation Perspective
As of 2026-03-29, FineTech trades at Market Cap ~USD 19M with PBR 0.93x. PER is not meaningful given 2025 net losses; based on the most recent profitable year (2024, Net Income USD 2M), trailing PER would be approximately 11x. The valuation reflects a business that must prove sustained turnaround before investors treat results as durable.
Key Risks
1. Equipment-cycle timing risk
Demand for display and battery manufacturing equipment shifts quickly with customer capex schedules. FineTech’s revenue pattern (81.4B → 44.8B → 71.0B → 46.4B over 2022–2025) shows how directly order timing drives results.
2. Cash flow and CAPEX mismatch
CAPEX rose from USD 4M in 2024 to 15.5B in 2025 while OCF turned negative (-3.5B), producing FCF of -13M USD. If this investment does not convert to revenue within the next few quarters, funding pressure could intensify.
3. Governance and forced-selling risk
The largest shareholder holds only 9.47%, with approximately 4.75% of total shares under collateral/pledge agreements across multiple contracts. A sharp stock decline could trigger margin calls and forced selling, potentially creating a cascade: lower price → forced sale → further price decline → governance instability. Conservative investors may prefer to wait until after any forced liquidation event before entering.
4. Short-term debt concentration
Total financial debt stands at approximately USD 34M, with USD 25M due within one year. Monitoring quarterly cash flow against this near-term repayment schedule is essential.
What to Watch Next
- Whether 2025Q4’s narrowing operating loss (-0.3B vs -1.6B in Q3) marks the start of a profitability inflection in upcoming quarters.
- CAPEX payoff: does the USD 10M invested in 2025 begin generating revenue and improving OCF in 2026?
- Order pipeline visibility: new contracts or backlog disclosures related to OLED, ESS, or India display manufacturing.
- Continuation of insider buying activity — particularly whether the largest shareholder maintains accumulation.
- Any changes to share pledge/collateral arrangements that could reduce forced-selling overhang.
FAQ
QWhat does FineTech actually make?
Display manufacturing equipment (bonding, inspection — 60% of revenue), display components (Touch System, Digitizer — 31%), and secondary battery manufacturing equipment (8%). Equipment is built to customer specifications, not mass-produced.
QWhy is insider buying significant here?
Multiple executives and the largest shareholder have been buying with personal funds during a period of operating losses. The largest shareholder alone accumulated 744,710 shares (approx. USD 370K total) since August 2024. This level of sustained buying during a trough suggests management sees a cycle turn ahead that the market hasn’t priced in.
QWhat are the biggest risks?
Three main risks: (1) equipment cycle timing — revenue swings 40–80% between years; (2) FCF deficit of -13M USD in 2025 from heavy CAPEX; (3) governance overhang from the controlling shareholder’s low 9.47% stake with 4.75% pledged as collateral, creating forced-selling risk on stock declines.
※ This article is based on publicly available financial data and is for informational purposes only. It does not constitute investment advice. Investment decisions and their consequences are the sole responsibility of the investor.