휴맥스 (Humax) (115160.KS) Stock Analysis 2026: Recovery vs. Structural Pressure in Gateways & Automotive Antennas
This article explores an undervalued Korean EV charging stock, Humax (115160.KS), which combines legacy gateway cash flows with emerging mobility and EV infrastructure exposure.
Executive Summary:
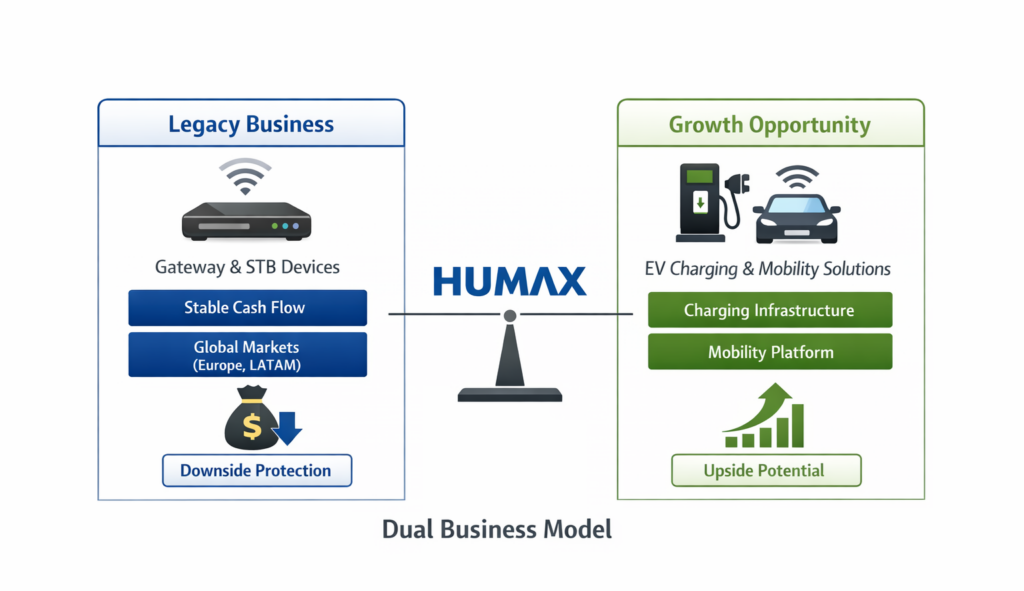
- Humax represents a deep value small-cap with a “barbell” profile:- Downside supported by legacy gateway/STB cash flows and global customer base
– Upside driven by underappreciated EV charging and mobility expansion - Despite persistent losses and governance overhang, the stock trades at 0.27x PBR, implying a high probability of structural decline.
- We believe the market is pricing Humax as a melting-ice-cube hardware business, while underestimating optionality in mobility and EV infrastructure.
- Key question: Is this a value trap, or a transition story?
📌 Investment Thesis: Why Humax Could Be an Undervalued Korean EV Charging Stock
-
The traditional set-top box (STB) market is in structural decline. However, smart STBs are evolving into home gateways, integrating Android OS, IPTV, OTT, and gaming functionalities.
-
While this segment is not a high-growth market, it still provides stable cash flow and downside protection, particularly through Humax’s strong presence in overseas markets (Europe, Latin America, and other emerging regions).
-
As a result, the legacy STB business should be viewed as a cash-generating base rather than a growth driver.
📌 Growth Option (Key Driver)
-
Beyond its legacy business, Humax is actively expanding into EV charging infrastructure and mobility solutions.
-
The company is building a combined model of:
-
charging hardware
-
and software/platform-based operations
-
-
This positions Humax as a potential energy/mobility platform player, not just a hardware vendor.
-
Importantly, the current valuation appears to underprice this transition, leaving room for potential re-rating if execution improves.
📌 Valuation & Entry Strategy
-
The floor conversion price of its convertible bonds (CB) is KRW 847, which provides a reference level for downside risk.
-
Accumulating shares below this level may offer a favorable risk-reward profile, although it should not be considered an absolute floor.
📌 Risks
-
Unresolved ownership succession issues
-
Ongoing corporate governance concerns
-
Execution risk in the EV charging and mobility business transition
→ These factors may delay valuation re-rating.
📌 Conclusion
Humax presents a barbell-type investment case:
-
Downside protection
→ Legacy STB business + overseas revenue base -
Upside potential
→ EV charging infrastructure + mobility platform expansion
However, timing is critical, and investors should monitor:
-
governance developments
-
and progress in new business execution
before aggressive positioning.
Key Catalysts to Watch:
– EV charging revenue contribution (% of total revenue)
– New OEM or infrastructure partnerships in mobility
– Stabilization of operating margins above break-even
– Reduction in financial/derivative losses
– Governance or ownership structure clarity
Why This Company Matters
휴맥스 (Humax) is a Seoul-based supplier of gateway devices (set-top boxes, broadband gateways) and automotive antennas. Humax matters to investors and industry observers because it sits at the intersection of consumer/pay-TV infrastructure and automotive connectivity hardware—two areas affected by secular trends (IPTV/OTT adoption, 5G/vehicle connectivity). The company’s product mix, existing OEM relationships and overseas subsidiaries provide exposure to both broadcasting/distribution infrastructure and the automotive electronics upgrade cycle.
Business Model Explained
Humax manufactures hardware platforms sold primarily to pay-TV operators, broadband service providers and OEM automotive customers. Revenue is driven by device unit shipments, product upgrades (e.g., Android TV/STB feature sets), and contractual supply to automakers for antennas. Profitability is sensitive to mix (gateway vs. automotive), component costs (HDDs, ICs), and one-off financial items; the company also performs R&D to sustain product differentiation (e.g., Android TV, 4K UHD, integrated antenna designs).
Revenue & Margin Snapshot
| Item | 2021 | 2022 | 2023 | 2024 |
|---|---|---|---|---|
| Revenue | 432 | 463 | 438 | 359 |
| Op.Profit | -34 | -4 | 8 | 4 |
| Op.Margin | -7.8% | -0.8% | 1.7% | 1.2% |
| Net Income | -27 | -34 | -53 | -41 |
| OCF | -11 | -15 | 25 | 55 |
| CAPEX | 4 | 13 | 4 | 2 |
| ROE | -11.0% | -15.8% | -31.6% | -36.8% |
| Quarter | Revenue | Op.Profit | Op.Margin | Net Income |
|---|---|---|---|---|
| 2025Q3 | 65 | -1 | -2.0% | 2 |
| 2025Q2 | 75 | -4 | -4.9% | -25 |
| 2025Q1 | 66 | -5 | -6.9% | -12 |
| 2024Q4 | 82 | -3 | -4.2% | -9 |
| 2024Q3 | 74 | 1 | 1.4% | -6 |
| 2024Q2 | 80 | 2 | 2.4% | -19 |
| 2024Q1 | 123 | 5 | 3.8% | -7 |
| 2023Q4 | 109 | 2 | 1.9% | -25 |
Revenue trend (annual)
▶ Revenue & Operating Profit Trend (USD M, approx.)

Quarterly revenue & operating margin
▶ Quarterly Revenue & Operating Profit Trend (USD M, approx.)

Key annual figures (select): 2019 revenue 787.4 USD M; 2020 586.7 USD M; 2021 431.9 USD M; 2022 462.5 USD M; 2023 437.8 USD M; 2024 359.3 USD M. Operating margins and net income have been volatile with recurring negative net income in recent years. Charts showing revenue and operating margin trends will be injected here automatically. Note: reported USD amounts are approximate; for context figures were provided at an exchange-rate basis and readers should consider an approximate conversion benchmark near 1,400 KRW/USD for back-of-envelope comparisons.
Recent Quarterly Performance
Quarterly results through 2025 Q3 show ongoing operating losses in 2025 quarters, with significant swings in net income driven by non-operational items in early‑to‑mid 2025. The pattern suggests operational break-even remains fragile and earnings volatility is elevated.
| Quarter | Revenue | Operating Profit | Operating Margin | Net Income |
|---|---|---|---|---|
| 2024Q4 | 82.5 USD M | -3.4 USD M | -4.2% | -9.1 USD M |
| 2025Q1 | 65.7 USD M | -4.6 USD M | -6.9% | -12.5 USD M |
| 2025Q2 | 75.1 USD M | -3.7 USD M | -4.9% | -24.9 USD M |
| 2025Q3 | 65.4 USD M | -1.3 USD M | -2.0% | 1.9 USD M |
Industry Context & Competitive Position
Humax operates in two distinct but related markets: broadcast/gateway devices (set-top boxes, broadband gateways) and automotive antennas. Industry tailwinds include increased IPTV/VOD penetration and the 5G-driven demand for MIMO/beamforming antennas in vehicles. However, demand is regionally uneven—mature markets show different dynamics than emerging ones—and product cycles are affected by platform shifts (OTT, Android-based STBs). Competitive peers range from large global telecom-equipment players to specialized European and domestic OEMs. Humax’s strengths include established OEM relationships, overseas subsidiaries and a mixed revenue base, while constraints include sensitivity to component supply/costs and a relatively small patent portfolio (domestic 10, international 22 patents as reported).
Balance Sheet & Financial Stability
Publicly reported annual statements show recurring net losses in recent years and negative ROE readings. While specific balance sheet line items (cash, gross debt) are not provided here, company disclosures and public filings indicate strained profitability and episodic financial losses (including derivative/financial losses disclosed in 2026 filings). These elements raise questions about liquidity and capital strategy if operational recovery is delayed. Readers should review company filings for up-to-date balance-sheet detail before forming views.
Valuation Perspective
The provided valuation snapshot reports Market Cap: 302 KRW100M, Current PER: -0.5x and Current PBR: 0.27x. The negative PER reflects the company’s unprofitable trailing earnings; PBR below 1x indicates the market values the equity substantially below reported book value on a headline basis.
Comparable peer data is limited in the materials supplied. While a list of competitors (domestic and global) is available, explicit trading multiples for those peers were not provided. Comparable peer data not currently available for this coverage.
Structurally, the combination of negative trailing earnings and low PBR suggests the market assigns a high probability of continued earnings stress or financial impairment absent visible turnaround catalysts. For companies with recurring losses, standard multiple-based interpretation centers on PSR (if revenue stability exists) or PBR (for balance-sheet-focused valuation); Humax’s mixed and declining revenue profile complicates a straightforward multiple signal.
Scenario framing: a stabilization in gateway demand and improved automotive antenna content per car could materially improve operating profit margins and lift multiples; conversely, further derivative/financial losses or weaker-than-expected orders would maintain depressed market valuation. The analyst note referenced above may imply thematic ideas to monitor, but it is a separate input and not a recommendation.
Key Risks
- Demand concentration and cyclicality: Regional disparities in IPTV and broadband adoption may depress gateway shipments in key markets.
- Financial/market risk: Reported derivative losses and large reported net losses have weakened reported profitability and could stress liquidity.
- Supply-chain and input-cost risk: Dependence on HDDs, ICs and other components exposes margins to commodity and supply volatility.
- Competitive & technological risk: Large global telecom equipment suppliers and platform shifts (OTT, Android TV) increase competitive pressure.
- Execution risk on mobility initiatives: Expansion into mobility (Humax Mobility) carries integration and commercial execution uncertainty.
What to Watch Next
- Quarterly order intake and backlog updates for gateway and automotive antenna segments.
- Disclosure updates on derivative/financial losses, any impairment charges or restructuring measures.
- R&D and product announcements—Android TV/STB upgrades or integrated antenna wins with OEMs.
- Regional sales composition changes (North America, Europe, Asia) and major customer contract renewals.
- Balance-sheet events: capital raises, debt maturities, or guarantees that affect liquidity.
FAQ
QWhat are Humax’s main businesses?
Humax sells gateway devices (set-top boxes, broadband gateways) to pay-TV and broadband operators and supplies vehicle antennas to automotive OEMs and component manufacturers.
QIs Humax profitable?
Humax has displayed inconsistent profitability. Recent annual reporting shows recurring net losses and volatile operating margins; the supplied trailing PER is negative (-0.5x), reflecting unprofitable trailing earnings.
QWhat drives Humax revenue and margins?
Revenue is driven by device shipments and OEM contracts; margins depend on product mix (gateway vs. automotive), component costs (HDDs, ICs), pricing dynamics with operators, and one-off financial items.
QHow does Humax compare to peers?
Humax competes with a mix of global telecom-equipment players and regional OEMs. Explicit comparable multiple data was not provided in the dataset, so a direct multiples comparison is not currently available.
QWhat are the largest near-term risks?
Near-term risks include regional demand weakness for gateways, component-cost pressure, derivative/financial losses, and execution risk in mobility-related businesses.
QWhere can I find more up-to-date financials?
Review Humax’s regulatory filings and quarterly reports for the latest balance sheet, cash flow and segment disclosure; these will detail any material derivative losses or debt-related events.
Humax Homepage: https://kr.humaxdigital.com/